


Summary and Microbiome Score
Your score out of 100; the shares of pathogens, Proteobacteria, Fusobacteria and Mycoplasmatota; and how many areas need review.
Test kits
 Core Gut InsightsFor digestive questions£279
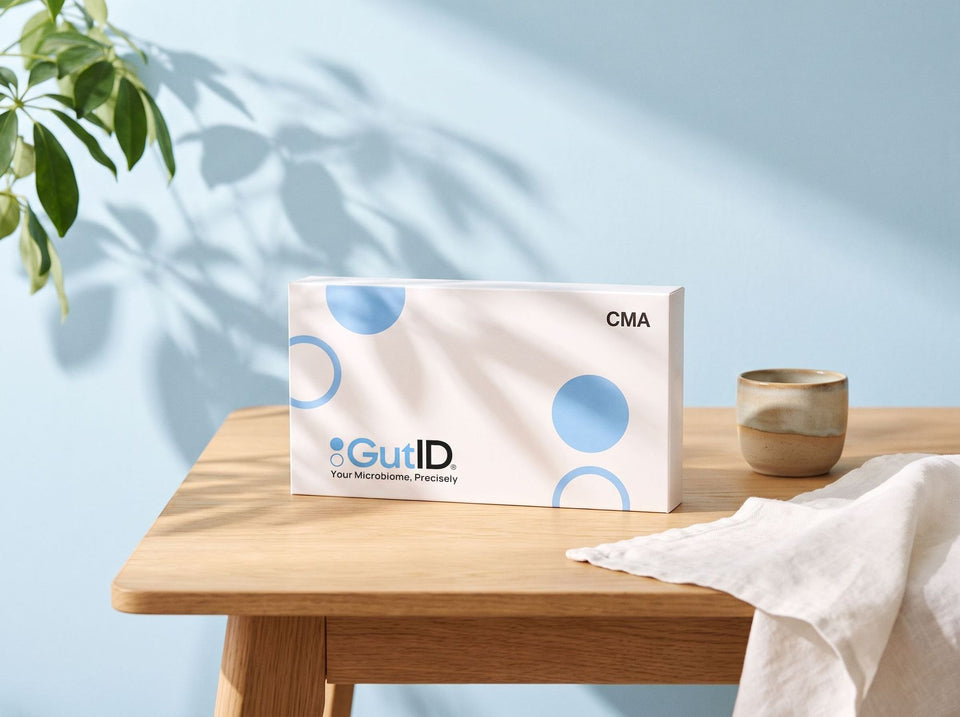 Complete Microbiome AssessmentAdds brain, immune, metabolism and heart axes£409
Help choosing
Also in the shop

 See inside a real reportPage 1: summary, score and Target Plot
Learn
From the Journal
 ConditionsSIBO: breath test or stool test?
 TestingHow often should you retest your gut microbiome?
 ResearchHow much weight the Firmicutes/
 How to read a Target PlotCenter to edge, phylum to species
Sample report
This is the layout every report follows. Get a matched pair of full reports from one de-identified person, baseline and follow-up, by email.

Real pages from de-identified GutID sample reports.
Anatomy of a report
Your score out of 100; the shares of pathogens, Proteobacteria, Fusobacteria and Mycoplasmatota; and how many areas need review.
Every organism in the sample, sized by its share. More colors usually mean a more diverse community.
Every area at a glance, with what to consider, such as a targeted probiotic, written beside the finding.
Resilience, richness, evenness and more, each value set against a typical range.
The most abundant species, with relative abundance, reference range and a flag when high.
Gut–Brain, Gut–Gastrointestinal, Gut–Metabolism, Gut–Heart and Gut–Immune, each with a summary and recommendations.
Every section above is cropped from de-identified GutID sample reports and shown exactly as it prints. Values are from the sample report.
One case, first test vs third

58.1%largest single species
59 species across 36 genera

18.8%largest single species
137 species across 89 genera
One de-identified case after a fiber recommendation (psyllium husk). By the third test the individual reported their IBS symptoms had resolved. Both Target Plots are shown exactly as they appear in the case’s reports. A single case; individual results vary.
The full reports
A matched pair from one de-identified person: the baseline report and the follow-up, every page as it was delivered. Choose Core Gut Insights or the Complete Microbiome Assessment.
These are de-identified examples. They do not predict your own results.
Loading the form…


